January 4, 2014
The Value of Growth
Introduction
The St. Lawrence waterway has huge lakes where the water hardly flows and Niagara Falls that's fast enough to make electricity. Overall the St. Lawrence is too slow to make electricity and too blocked for shipping but regionally you can do both, where its appropriate. Business over its lifetime is like the St. Lawrence, it start out as a trickle, grows big and disappears into the ocean. There is an appropriate way to invest in each of its stages.The point I make is the difference between vegetative growth (toothpaste) and the growth of emerging markets (PCs, laptops, tablets, smart phones). There is vigorous growth in their middle years where often the high P/E ratios are not just justified but understate the value of the growth.
Intrinsic Value
Everyone knows what intrinsic value is but no one seems to know how to calculate it. I've scoured Graham and Dodd's Security Analysis for the intrinsic value formula and it's not there. Not only that, in the various editions their definition changes. Originally, when bonds were investments and stocks speculation, intrinsic value was essentially book value. Later it morphed into going concern value. The best definition I have seen is "the discounted present value of all future cash flows." While the formula exists, the inputs are guesses at best because no one knows or can know how much cash a business will throw off in the future nor what the discount rate will be. DCF is a leaky life raft at best but we will put it to good use.Discounting The Hereafter
 70% growth
 60% growth
 50% growth
 40% growth
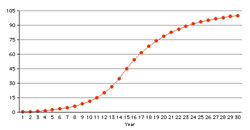 30% growth
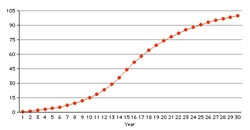 22% normal growth?
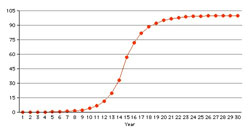
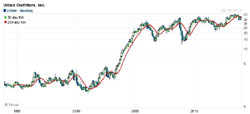 Urban Outfitters (URBN) real world example of "S" curve growth
For a stock with P/E ratio of 100 my broker used to say that you are not only discounting Eternity but the Hereafter. It certainly is true for a flatliner, a no-growth stock like we saw above. If you hold that 100 P/E stock for 100 years your yield will be 1%. But what if the earnings are growing at, say, 5%?
The P/E 15 stock growing at 5% will earn $1.98 in year 15. At the same P/E ratio of 15 it will sell for $29.70 giving you a yield of 11.45% instead of the original 6.67%. Not quite a double.
The P/E 100 stock growing at 5% will earn $125.24 in year 100. At the same P/E ratio of 100 it will sell for $12,523.93 giving you a yield of 5.97% instead of the original 1.00%, almost six times as much. There is value in growth!
The Anatomy of Growth
Not all growths are the same. There is vegetative growth, an increase proportional to the growing universe of consumers which is what sellers of toothpaste might expect unless they convince people to brush more often. As a long time Toyota Corolla owner I discovered that Toyota supercharged vegetative growth by making newer versions of the Corolla more upscale and more expensive. There is another kind of growth that is much more fast and furious, the adoption of new technologies such as the iPhone. Geoffrey Moore's The Gorilla Game goes into great detail about how disruptive technology grows. Doubling of revenue year over year (100% growth) is quite common for a limited number of years during the so called "Tornado."Sigmoid or "S" Growth Curve
This rate of growth is quite common in nature from zero to 100% market penetration and it can take a long time. The Urban Outfitters chart to the right is 20 years and two months long. The center third shows the "S" curve clearly. The growth to the right is basically vegetative, their particular style has reached 100% penetration for all practical purposes. The nature of the investment changes as the companies go through their various stages in life.Note: The Urban Outfitters chart is drawn on a semi-log scale while the other charts are drawn on the linear scale meaning they are not entirely comparable.
In general terms adoption has four groups of buyers: Innovators and early adopters (16%), early majority (34%), late majority (34%), and laggards (16%). The pace of adoption tends to generate a normal or bell curve (not shown). The "S" or growth curve shows market penetration.
The percentages shown above (16, 34, 34, 16) are the idealized market shares of each group. The time distribution tends to be one third for innovators and early adopters, one third for early and late majority, and one third for laggards. The "S" curve forms because there are so many more buyers per unit of time in the middle. The "S" can be more or less pronounced and it will have a strong effect on valuation. Compare the graphs in the sidebar, see how much more pronounced the "S" is at 70% growth (top graph) than at 22% growth (bottom graph).
Valuing Growth
Discounted cash flow (DCF) works rather well with bond like securities that have specified disbursements but not so well with more uncertain securities like common stocks. DCF also works well in generating comparative models and this is how it is used here to generate various P/E ratios based on given growth rates and discount rates. The objective is not to determine the right P/E ratios but to generate a set of numbers that investors can compare against their practical experience with growth stocks.The benchmark model is derived from the S&P 500 price history, a 64 year cash flow growing at a vegetative rate of 7.62% per annum. The discount rate is set to make this cash flow have a P/E ratio of 15. The discount rate that most closely approximates a P/E of 15 is 15.197%. This is the discount rate used for calculating the P/E ratio of various sigmoid growth rates.
The sigmoid curves are generated using the nominal growth rate for 15 years followed by 15 years at half the nominal growth rate. Since this generates universes (markets) of vastly different sizes, the results are normalized to 100 and the results can be read as the percentage of market penetration. To make the P/E ratio more comparable to the 64 year base model a further 34 years were added with the same vegetative growth rate as the base model, 7.62%. This correction has a minimal effect, increasing the P/E ratio by less than 2%.
Results
Had I used a proper sigmoid function the lines in the graph below would be smooth curves. The results are close enough for the purposes of this analysis. The red S&P line is the baseline at P/E 15.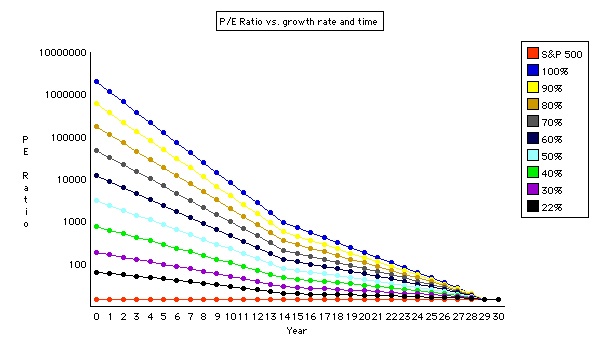
Show data
Year
S&P
500
500
22%
30%
40%
50%
60%
70%
80%
90%
100%
0
15.0
64.7
188.1
768.0
3,161.1
12,635.0
48,348.4
176,250.7
611,696.0
2,024,202.4
1
15.0
60.2
166.2
633.3
2,436.6
9,136.8
32,918.8
113,366.9
372,819.5
1,172,222.4
2
15.0
56.0
146.8
521.9
1,877.5
6,604.9
22,405.5
72,893.2
227,143.8
678,578.8
3
15.0
52.1
129.5
429.9
1,446.1
4,773.1
15,244.9
46,853.5
138,341.9
392,678.5
4
15.0
48.3
114.1
353.9
1,113.3
3,447.9
10,369.7
30,105.5
84,230.9
227,159.9
5
15.0
44.7
100.4
291.1
856.8
2,490.1
7,051.6
19,339.7
51,268.8
131,369.4
6
15.0
41.3
88.3
239.3
659.0
1,797.7
4,793.6
12,419.9
31,197.2
75,951.0
7
15.0
38.1
77.5
196.5
506.7
1,297.3
3,257.7
7,974.0
18,978.7
43,899.3
8
15.0
35.1
67.9
161.2
389.3
935.8
2,213.2
5,118.2
11,542.7
25,367.2
9
15.0
32.3
59.4
132.1
298.9
674.8
1,503.1
3,284.2
7,018.3
14,654.9
10
15.0
29.6
51.8
108.1
229.3
486.2
1,020.5
2,106.8
4,266.3
8,464.3
11
15.0
27.0
45.1
88.3
175.6
350.1
692.4
1,351.0
2,592.7
4,887.6
12
15.0
24.6
39.1
71.9
134.4
251.9
469.6
866.0
1,575.1
2,821.5
13
15.0
22.3
33.8
58.4
102.6
181.0
318.2
554.7
956.5
1,628.3
14
15.0
20.1
29.1
47.3
78.2
129.8
215.3
355.1
580.5
939.3
15
15.0
19.9
28.2
44.5
71.2
114.3
183.2
291.9
461.3
722.0
16
15.0
19.6
27.3
41.9
64.8
100.6
155.8
239.8
366.4
554.8
17
15.0
19.3
26.3
39.3
58.9
88.4
132.3
196.8
290.8
426.0
18
15.0
19.0
25.4
36.8
53.4
77.5
112.2
161.4
230.6
326.9
19
15.0
18.7
24.5
34.4
48.4
67.9
95.0
132.1
182.7
250.7
20
15.0
18.4
23.6
32.1
43.7
59.4
80.3
108.1
144.5
192.0
21
15.0
18.1
22.6
29.9
39.4
51.8
67.8
88.2
114.2
146.9
22
15.0
17.8
21.7
27.8
35.4
45.1
57.0
71.8
90.0
112.2
23
15.0
17.4
20.7
25.7
31.8
39.1
47.9
58.4
70.8
85.5
24
15.0
17.0
19.8
23.7
28.4
33.8
40.0
47.2
55.5
65.0
25
15.0
16.7
18.8
21.9
25.3
29.1
33.3
38.1
43.4
49.2
26
15.0
16.3
17.9
20.0
22.4
24.9
27.6
30.6
33.7
37.0
27
15.0
15.9
16.9
18.3
19.7
21.2
22.7
24.3
26.0
27.7
28
15.0
15.4
16.0
16.6
17.3
17.9
18.6
19.2
19.9
20.5
29
15.0
15.0
15.0
15.0
15.0
15.0
15.0
15.0
15.0
15.0
30
15.0
15.0
15.0
15.0
15.0
15.0
15.0
15.0
15.0
15.0
Conclusions
The graph clearly shows that the higher the growth rate the higher the value of the security and the reason why Mr. Market is willing to pay higher P/E ratios for growth.Before doing this analysis I thought that the highest value would be at the "curve in the hockey stick," where the early majority kicks in. The graph says that the earlier you buy the higher the return of the growth stock. This would be true if one had a guarantee that the growth will, indeed, happen. Absent that guarantee, the investor must ask for a discount to the calculated DCF or he must use a higher discount rate.
Entrepreneurs don't have a guarantee, they trust their capitalistic instinct and the great majority of startups fold early never becoming going concerns. To verify that in the real world astronomical P/E ratios make sense, let's take the case of Microsoft. Gates and Allen joined forces in 1975. Let's assume they invested $100,000 in founding Microsoft which after 38 years has a market CAP of $300 billion in 2013. That is a CAGR of 48.06% - a P/E ratio of 2.1. To reach $300 billion in 38 years compounding at 7.62% (the long term CAGR of the S&P 500), Gates and Allen would have had to invest $18,415,500,000 ($18.5 billion).
Of course there are no guarantees, IBM could have made a deal with Digital Research, their first option, had Dr. Gary Kildall not refused to deal with IBM.
The first incontrovertible conclusion is that growth is valuable, the issue is how much you should pay for it. The second is that early on the uncertainty of arriving safely at the desired destination is very high and one cannot or should not pay the value calculated using DCF. The third is that one should invest at the earliest opportunity after determining that the business is viable, once the herd catches on the price will jump to new highs. Still, one should not be deterred by an apparently high P/E ratio. One must gauge as accurately as possible the rate of growth of earnings or cash flow or some other meaningful proxy and the length of time until the business reaches market saturation. With this data at hand one should be able to asses the value of the business.
Denny Schlesinger
Edited January 5, 2014 to add the introduction
Copyright © Software Times, 2000 - 2013. All rights reserved.
Last updated January 4, 2014.
Last updated January 4, 2014.