December 26, 2013
Investing in Disruptive Technologies
This essay is about investing in common stocks known as growth stocks and excludes many specialties like turn arounds, falling knives, asset plays, and other special situations because the systemic nature of their markets, their market logic, is different. Some of the methods described here might apply to these other stocks but describing the investing strategy for just one kind of stock is difficult enough without having to take side trips to cover other kinds of situations.
Today it is widely accepted that the stock market is a complex system but when you visit investing forums or read investing letters what you find are very traditional discussions based on neoclassic economics. In addition, market participants still make a hard distinction between investing and trading. While I certainly distinguish between day-trading and investing, there is a certain amount of trading that is part and parcel of investing.
The method described was not developed in the order presented. Rather it was developed piece by piece over many years and eventually the pieces were assembled (or fell into place) into a logical whole. There is no attempt to explain the underlying realities like complex systems or sigmoid growth curves. This is not a scientific treatise. It's an empirical investing guide based on these realities.
Complex Systems
 Complexity: The Emerging Science at the Edge of Order and Chaos by M. Mitchell Waldrop
This is not the place to cover complex systems in any detail. For a layman's introduction I recommend Mitchell Waldrop's highly readable Complexity: The Emerging Science at the Edge of Order and Chaos which is the book that started my journey into this fascinating science. For a piece more directly pertinent to investing I urge the reader to watch Stuart Kauffman's 2008 lecture The Evolution of Economic Wealth and Innovation. Kauffman explains why complex systems, while not predictable, still exhibit statistical properties. These two characteristics are bedrocks of the investing method described below. While there are many lectures on complex systems, I like this one because Kauffman focuses on wealth creation and our purpose is to get a share of that wealth.
A second lecture I recommend is by Duncan Watts at the Santa Fe Institute The Myth of Common Sense: Why Everything that Seems Obvious Isn't which is not about complex systems but about what happens when we apply Newtonian logic to them. The two key takeaways from Watts's lecture are:
What's wrong with Newtonian logic? It works for Newton's laws of gravity and celestial mechanics, for Einstein's laws of relativity and for Shrödinger's quantum mechanics which all exhibit cause and effect. Newtonian logic is the basis of much of common sense and is deeply ingrained in us. Complex systems don't work that way, they rely on survival of the fittest (adaptation), and emergent properties which are not predictable on the basis of cause and effect. Our deeply ingrained common sense makes us create cause and effect stories about events of complex systems. Just read the financial headlines
- Build strategies that don't require you to do what you can't do [forecast complex systems, it can't be done], and
- Forget about planning and forecasting altogether and instead get very good at measuring and reacting [use the statistical properties of the complex system to advantage].
These headlines cater to our inner need to find causes for the effects we see. "More buyers that sellers" is not enough to explain to us rising prices. We must know why there are more buyers that sellers but if the cause is "GDP Growth," there should only be buyers and no sellers. The sellers must be motivated by something else, something the headlines are not telling us. As Kauffman demonstrates, there is no telling why the price rose or fell but we crave our dose of Newtonian common sense.
- Why MasterCard, Up 64% in 2013, Isn't Done
- Stocks rally on GDP; Dow has best week since Sept.
- Why Netflix has hit its peak
- 5 Reasons why the real estate re-boom is about to slow way down
- Dow Jumps to All-Time High as GDP Growth Hits 4.1%
To overcome our faulty common sense we need to replace it with a systemic approach to investing which does not rely on forecasting but on reliable, on recurring properties of investment vehicles.
Statistical Properties of Growth Stocks
Growth stocks share some statistical properties with all stocks. The sigmoid curve is particular to growth, it describes how growth happens, how innovation is adopted.The Sigmoid or "S" Curve
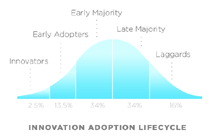 Innovation adoption curve
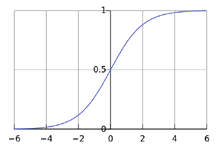 An "S" or sigmoid curve
The percentages shown above (16, 34, 34, 16) are the idealized market shares of each group. The time distribution tends to be one third for innovators and early adopters, one third for early and late majority, and one third for laggards. The "S" curve forms because there are so many more buyers per unit of time in the middle. The growth of the stock price is accelerated in the middle even more because the market likes to pay for fast growth.
I'd like to point out here that we have made no predictions. We have only described the life-cycle of an innovation much like we can describe the life-cycle of a human as childhood, adulthood and elderhood. Not all humans survive to elderhood but if they do they must pass through childhood and adulthood first. Based on this empirical observation we have developed activities or strategies for each stage of life.
You won't find perfect curves as illustrated here in stock price charts, nonetheless we need to look for the two telltale curves, the so called hockey stick curve that separates early adopters from early majority and the reverse curve at the top that separates the late majority from the laggards. These two curves will delimit the three investing/trading strategies we will use over the life-cycle of the investment. The good news is that there are markers in the real world that help identify and confirm these two state changes. Since they are particular to industries, for example store count for retail, they will be mentioned later as opportunity arises.
The Three Strategies
For simplicity I will call the various parts early, middle and late strategy.Early Strategy
The first step is to find a growth stock. Unfortunately there is no way of telling if a stock will grow until it grows and by then the price is likely to be quite steep. This is a major problem with things that have emergent properties, you don't know what they are until they emerge, there is no cause and effect sequence that you can use to predict the emergence. The common procedure is to wait until there is some form of confirmation before making an investment. For example, Peter Lynch tells you to look for concepts that can be reproduced across markets. You can't know if the concept can be reproduced until it is reproduced across a number of markets. Peter Lynch further advises against investing in long shots which a potential growth stock certainly is. Geoffrey Moore tells you in The Gorilla Game to wait for the Tornado, then buy the basket and wait to find who the winner is to sell the losers. The objective in each case is to avoid losing money on losers.Traditionally such early stage investing is best left to venture capitalists and angel investors and that was my advice until I devised a method for trading and accumulating these stocks. I further grant that this is more speculation than investing. I believe that one can accumulate a good number of shares at a profit long before the herd catches on and sends the stock to the moon. I've heard that venture capitalists are happy to have one winner in ten. My expectation is not better but I expect to break even on the losers.
Since the outcome of any one idea is highly uncertain, one should start by putting a very small fraction of one's portfolio into any one idea. The trading itself will tell you if you should or should not add to the position. The objective is to accumulate a good number of shares at an average cost well below the current price by the time the stock reaches its first critical point, the hockey stick curve, which is where the early strategy ends and the middle strategy starts. Should you lose faith in the idea or if it proves to be unrealizable, terminate it, hopefully at a profit.
Finding Disruptive Ideas
I can't tell you where or how to find these ideas. George Gilder was a good source as was The Gorilla Game. I've invested in medical robots, green energy, rare earths and electric vehicles.Computer Motion [RBOT], 2/24/1998 - 1/12/2000
Computer Motion designed, developed and marketed medical robots. It was not successful and was eventually bought out by Intuitive Surgical who discontinued their products to eliminate a potential competitor to daVinci.Progress at Computer Motion was very slow which made me uneasy. My broker's son in law was a doctor in New York and they had a daVinci robot. As I recall, doctors preferred the daVinci over Computer Motion's offerings. The slow progress and this negative opinion convincd me to terminate the investment.
Result: 19% internal rate of return. Show trades
Date
Action
Price
2/24/1998
First purchase
$10
4/15/1998
Add
11 3/16
5/11/1998
Take profit
16 1/8
7/1/1998
Buy
13 5/8
7/7/1998
Add
10 1/8
8/28/1998
Add
7 7/16
9/23/1998
Add
8 1/4
1/12/2000
Terminate
10 7/8
Denny Schlesinger
Copyright © Software Times, 2000 - 2013. All rights reserved.
Last updated December 28, 2013.
Last updated December 28, 2013.