February 20, 2011
Why Does the Average Mutual Fund Underperform?
  Pareto Distribution
  $10,000 between
  100 participants

      Income  Cumulative
  1   772.85      772.85
  2   713.14    1,485.98
  3   658.04    2,144.02
  4   607.20    2,751.22
  5   560.29    3,311.51
  6   517.00    3,828.51
  7   477.06    4,305.57
  8   440.20    4,745.77
  9   406.19    5,151.96
 10   374.81    5,526.76
 11   345.85    5,872.61
 12   319.13    6,191.74
 13   294.47    6,486.22
 14   271.72    6,757.94
 15   250.73    7,008.67
 16   231.36    7,240.03
 17   213.48    7,453.51
 18   196.99    7,650.50
 19   181.77    7,832.27
 20   167.73    8,000.00
 21   154.77    8,154.77
 22   142.81    8,297.58
 23   131.78    8,429.35
 24   121.60    8,550.95
 25   112.20    8,663.15
 26   103.53    8,766.69
 27    95.53    8,862.22
 28    88.15    8,950.37
 29    81.34    9,031.72
 30    75.06    9,106.77
 31    69.26    9,176.03
 32    63.91    9,239.94
 33    58.97    9,298.91
 34    54.41    9,353.33
 35    50.21    9,403.54
 36    46.33    9,449.87
 37    42.75    9,492.62
 38    39.45    9,532.07
 39    36.40    9,568.47
 40    33.59    9,602.06
 41    30.99    9,633.05
 42    28.60    9,661.65
 43    26.39    9,688.04
 44    24.35    9,712.39
 45    22.47    9,734.86
 46    20.73    9,755.59
 47    19.13    9,774.73
 48    17.65    9,792.38
 49    16.29    9,808.67
 50    15.03    9,823.70
 51    13.87    9,837.57
 52    12.80    9,850.37
 53    11.81    9,862.18
 54    10.90    9,873.07
 55    10.06    9,883.13
 56     9.28    9,892.41
 57     8.56    9,900.97
 58     7.90    9,908.87
 59     7.29    9,916.16
 60     6.73    9,922.88
 61     6.21    9,929.09
 62     5.73    9,934.82
 63     5.28    9,940.10
 64     4.88    9,944.98
 65     4.50    9,949.48
 66     4.15    9,953.63
 67     3.83    9,957.46
 68     3.54    9,961.00
 69     3.26    9,964.26
 70     3.01    9,967.27
 71     2.78    9,970.05
 72     2.56    9,972.61
 73     2.36    9,974.97
 74     2.18    9,977.16
 75     2.01    9,979.17
 76     1.86    9,981.03
 77     1.71    9,982.74
 78     1.58    9,984.32
 79     1.46    9,985.78
 80     1.35    9,987.13
 81     1.24    9,988.37
 82     1.15    9,989.52
 83     1.06    9,990.58
 84     0.98    9,991.56
 85     0.90    9,992.46
 86     0.83    9,993.29
 87     0.77    9,994.06
 88     0.71    9,994.76
 89     0.65    9,995.42
 90     0.60    9,996.02
 91     0.56    9,996.58
 92     0.51    9,997.09
 93     0.47    9,997.56
 94     0.44    9,998.00
 95     0.40    9,998.40
 96     0.37    9,998.78
 97     0.34    9,999.12
 98     0.32    9,999.44
 99     0.29    9,999.73
100     0.27   10,000.00

Note: This table might
not be technically
accurate but it is close
enough to illustrate the
argument.
Pareto Distribution
 Italian economist Vilfredo Pareto observed in 1906 that 20% of the Italian population owned 80% of the land. Later it was discovered that many other things are also distributed according to the Pareto Principle or the 80-20 rule as it is more commonly known. The 80-20 rule also applies to mutual funds and to all investors.
Saying 80-20 does not illustrate just how uneven such a distribution is. The results of the 80-20 rule are stark, dreadfully stark for those on the low end of the range. To bring out the reality of the 80-20 rule I have created the idealized 80-20 distribution shown on the sidebar. I added color highlights to three important way-points, the top 20, the break-even and the bottom 50%. The data in the sidebar is shown graphically below:
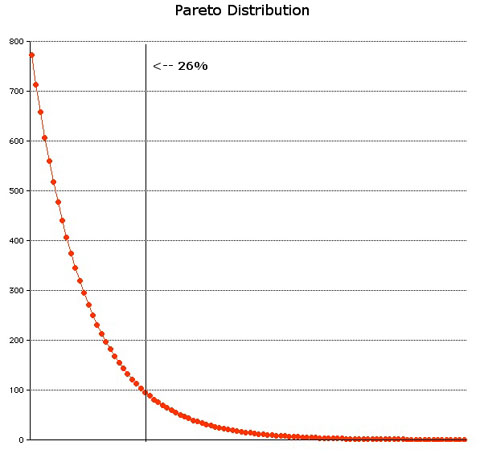 The average income is $100 and just 26% of the population make $100 or more as show by the yellow highlight in the sidebar and the 26% vertical line in the graphic. It also means that 74% underperform the index. More on that later.
So far, the news has not been all that shocking. It gets worse. The bottom 50% get, between them, just $191.33, 1.9% of the whole. On average they get $3.83. The bottom most gets 27 cents.
It is easy to argue that this is an unfair distribution of wealth. The perverse aspect of the game is that if you try to improve the fairness of the distribution the bottom earners won't earn more while the top earners will earn a lot less bringing down the collective standard of living. But that is a subject for a different essay.
The Stock Market Games
The stock market is not one game but two: There is a zero sum game that has investors selling securities to each other and there is the other game represented by the stock market index. The sidebar ignores the rise and fall of the index. If the market had zero gains, all the amounts in the sidebar would have to be reduced by $100. The distribution would remain the same but the top earner would earn $672.85, $100 less than shown and the bottom earner would lose $99.73 instead of making 27 cents.The historic rise in the market is around 10%. Anything you make above that someone else has to lose otherwise the index would have risen more. What the Pareto Distribution or 80-20 rule says is how wealth gets distributed. A savvy professional can improve his position but cannot change the overall market performance, his extra profits have to come out of someone else's losses.
Let's suppose the market has just one stock, XYZ. Every professional falls in love with XYZ and the stock doubles. So does the index! Relative to the index, they have all underperformed by the amount of the expense of their funds. The way for one professional to beat the index is by having some other professional underperform the index. Simple arithmetic, I'm afraid.
Performance Expectations
Extrapolating from the Pareto Distribution, expect three out of four mutual funds and financial advisers to underperform the market under average conditions.In a roaring bull market (40% gain) expect two out of three to lose you money. Even when the market rises by 80% you can expect half the mutual funds and financial advisers to lose you money.
On the other hand, if you pick the good or the lucky fund or adviser, you will make lots of money. If you pick a second decile fund or adviser and the market advances 10%, you can expect to gain 57% less fees. With a top decile advisor you can expect 363% less fees. But with a third decile fund or adviser you are underperforming the market and with a fourth decile and down, you are losing money.
This is where index funds come in. When picking a mutual fund or a financial advisor, if you luck out you make lots of money but with three out of four you underperform or actually lose money. If this is not a tradeoff you want to make, an index fund should return average amounts over time making it the safer way to invest your money.
Denny Schlesinger
Pareto Principle - The 80-20 Rule - Complete Information
Copyright © Software Times, 2000, 2001, 2003. All rights reserved
Last updated March 8, 2009.
Last updated March 8, 2009.