January 22, 2012
Are Great Companies Great Investments?
I don't think that investors pay enough attention to the way companies and their stocks grow and eventually decline over their lifetime. Investing is not an escalator to financial heaven and it's not just the usual volatility that I have in mind. During the earlier part of a successful company's life cycle it tends to have a remarkable growth spurt that investors can and should exploit for their own benefit. Harry S. Dent calls it the "S" curve. Geoffrey Moore talks about the Technology Adoption Life Cycle (TALC). In The Tipping Point Malcolm Gladwell talks about how epidemics happen. These are all manifestations of the same phenomenon, a growth spurt that an aware investor can take advantage of. Peter Lynch was always searching for the elusive "Ten Bagger" which is, again, the same thing. While reading the Costco POD, I decided to investigate its past to see if this phenomenon had happened to its stock. It did!
Emerging Retail and Apparel
That investing needn't be complicated is probably the central message of One Up on Wall Street and to leverage what one already knows. Shopping is something most of us do on a continuing basis. A visit to the Mall is a great opportunity to do market research. Peter Lynch is famous for coining the phrase "Ten Bagger," a stock that grows ten fold in a relatively short period of time. A ten bagger is essentially the same as the "S" curve growth or the Tornado of fast adoption. Further, Lynch advises to look for the successful concept that can be replicated across markets. The most visible examples are retail stores and eateries that are born locally and later catch on at national and international scales.
Having made a profitable incursion into some retail stocks I came to realize that this was a great hunting grounds for the elusive ten bagger and an area that was much simpler than hunting for high tech investments that can be incomprehensible for the ordinary investor. The way we shop evolves with changing demographics. In the late 19th Century, Richard Warren Sears followed the railways. In the 1950s Sam Walton opened variety stores in small towns. The move to suburbia saw the birth of the shopping mall. Successful concepts catch on, grow like weeds, and eventually die out. Dunkin' Donuts, pet rocks, Toys R Us, and dozens of others present great investing opportunities if taken at the right time. In The Tipping Point Gladwell includes the story of the Airwalk shoes that had great initial success but which management messed up killing a potential ten bagger.
The objective of the Emerging Retail and Apparel board is to systematize the search for these emerging opportunities and to allow like minded investor to share their finds.
Costco [COST] from 6 to 60 in 5 years
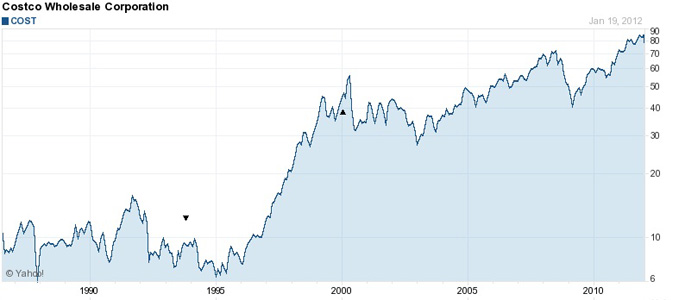
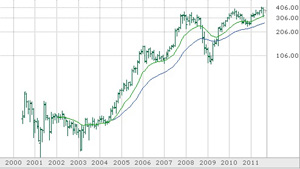
Costco is a poster boy of a great company that had a wonderful 'emerging' period. While we can never turn the clock back to capture it, it serves as a lesson for picking out current "Emerging Retailers." Emergence leaves a fossil record as surely as dinosaur bones do. Look for the "S" curve in the stock's price history: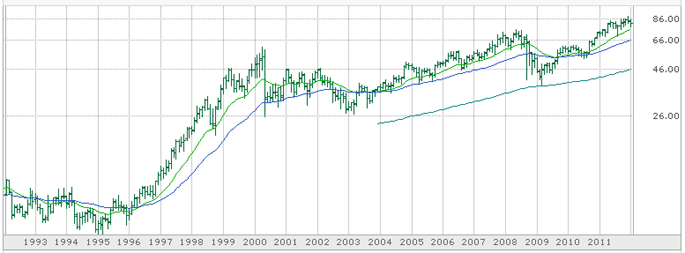
The Ameritrade chart above does not tell the full story but it's where I can check prices easily. $6 during March 1995. $60 during April 2000. A ten bagger in five years! The Yahoo! chart below shows just how lumpy COST was before that golden period which is one of the reasons it's so difficult to put your money on a 'future' emerging retailer.
I haven't followed Costco so I don't know its story but what one needs to do is to find that successful concept that can be replicated across markets. It's a combination of liking the company's underlying business philosophy, the Main Street liking the products and service, and Wall Street liking the stock. Get in too early and you are likely to get burned. Get in too late and you miss a lot of bags.
Compound Annual Growth Rate (CAGR)
An investment portfolio, all else being equal, is about CAGR. During Costco's emerging period, 6 to 60 in five years, it had a CAGR of 57.2%. From 60 to the current 81.42 is a measly 2.6%. I don't care how great the company is, as an investment it's a bomb. Even if you got in when the stock dropped from 60 to 26 in May 2000, you would still only have a CAGR of 10.2% (plus dividends).CAGR is additive. Even if you buy a couple of duds, if you also buy a Costco at the right time, your portfolio is likely to outperform. This is at the core of Peter Lynch's investment philosophy, look for that elusive ten bagger. This is what I hope to achieve searching for "Emerging Retailers."
The Anatomy of an "S" Curve
The stock market is populated by bubbles which look remarkably similar to the "S" curve during the first half but differ sharply in the back half. When a bubble bursts, the price collapses. When an "S" curve is exhausted, the price flat-lines producing a low or no CAGR return going forward. This difference is critical for the investor because riding an "S" curve is much less dangerous than riding a bubble.While I have not made a scientific study of it, it would seem that bubbles are driven mainly by market mania unleashed by an event such as the injection of excess liquidity into a market (2008 housing bubble), excess debt (1998 LTMC), trade policy (2011 rare earths). A bubble is driven solely by "the voting machine" without the benefit of real underlying value or, if there is underlying value (telecom boom), by excessive valuation above said value. The "S" curve is tied more closely to the underlying business, hence to the "value machine."
Take any successful new product, concept or technology. First the innovators try it, then the early majority. If the company and the product survive this difficult early period, momentum starts to build as more people buy into the concept. It is around here that the so called "curve in the hockey stick" forms, the bottom of the building "S" curve. One of the best gauges of a prospective "S" curve is revenue growth or growth of the number of items shipped. Geoffrey Moore called it "The Tornado," a period during which revenue or items shipped grow at close to a 100% annual rate. The company might not yet be profitable but so much the better if it is. If not, one has to consider the cash burn rate and the upcoming share dilution as the company seeks more working capital. Depending on how risk-averse the investor is, it might make sense to wait until the company turns a profit before investing.
This early period has been very difficult for me. I'm often too eager and buy too early or I put it off and forget about it until it is too late. My solution has been to buy a small "starter" position to keep me interested and in touch without much capital at risk.
The top of the "S" curve forms when the market has been saturated (Dent estimates 90% market penetration, I think less). As growth slows multiples drop and earnings per share grow faster than share price. This situation causes many "value investors" to buy the stock they now see as safe. It might be safe but returns are likely to be under par.
The middle part of the "S" curve is just as difficult. Fast growing stocks have high multiples and tend to be highly volatile. Any minor difficulty can translate into a 50% drop in the share price. Is that the time to sell or to load up? It really depends on the state of "the story." If the story is intact it might be a good time to buy more. If the story has reached an end, sell. It might also be a good idea to take profits once in a while because the future is always uncertain but I would advise against "balancing" the portfolio as strongly as Modern Portfolio Theory (MPT) would suggest -- don't waste the "S" curve!
Why Do "S" Curves Form and Why Do They Not Collapse Like Bubbles Do?
Automobile adoption curve
ISRG adoption curve
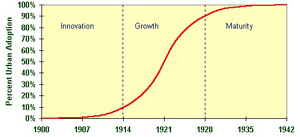
Very few people in 1900 possessed automobiles; it was a toy for the rich. Between 1900 and 1914 the automobile went through its innovation phase. With the assembly line automobiles became affordable. Between 1914 and 1928 the automobile went through its growth phase from 10% to 90% of urban families. -- From safehaven.comThe automobile innovation shows a growth period of fourteen years. In his book Dent shows the growth period for the radial tire to be seven years. Costco's growth period was just five years. Intuitive Surgical's [ISRG] growth period was just over four years. Urban Outfitters [URBN] had growth period of five years.
If businesses as diverse as automobiles, tires, medical robots, wholesale clubs and fashion retailers all exhibit the "S" curve growth then this is not some sort of fluke but a natural event in the life cycle of new businesses. Typically a business is valued based on the cash flow it throws off, on the discounted present value of said cash flow as compared to the so called risk free rate. A growing business is increasing its cash flow and therefore it is valued at a higher multiple than a steady state business. The middle of the "S" curve price chart reflects the increasing tempo of adoption of the technology, product or service. As the market becomes saturated, growth slows and the multiplier decreaes as well. The late buyers of the stock are condemned to a long period during which, even if earning per share grows, the stock does not move because the multiplier is shrinking. Late in the game the stock is overpriced.
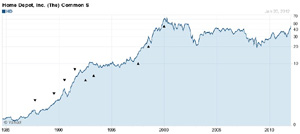
HD price chart
BTW, two consecutive "S" curves is not all that uncommon. Wal-Mart [WMT] has a 12 year "S" curve from 1980 to 1992 and a shorter one from 1996 to 2000. It can happen when the company finds a new line of business or some other profitable extension but the second "S" curve is much harder for the investor to discover in time.
To answer the last part of the question, bubbles don't represent value, only price inflation due to excessive optimism, excessive demand. When that optimism runs out, the house of card collapses. The good news about the "S" curve is that exiting the position at the top is not critical. It can be done in an orderly manner because the stock price is not likely to collapse and if it does, more than likely it will bounce back. There is value supporting the "S" curve.
Denny Schlesinger
Not Hating Costco by Fool michaelservet
Emerging Retail and Apparel board at TMF
The Roaring 2000s: Building The Wealth And Lifestyle You Desire In The Greatest Boom In History by Harry S. Dent
The Gorilla Game: Picking Winners in High Technology by Geoffrey A. Moore
One Up On Wall Street: How To Use What You Already Know To Make Money In The Market by Peter Lynch and John Rothchild
The Tipping Point: How Little Things Can Make a Big Difference by Malcolm Gladwell
Why Does the Average Mutual Fund Underperform?
The Innovation Wave and Secular Market Trends
Copyright © Software Times, 2000, 2001, 2003. All rights reserved
Last updated March 8, 2009.
Last updated March 8, 2009.